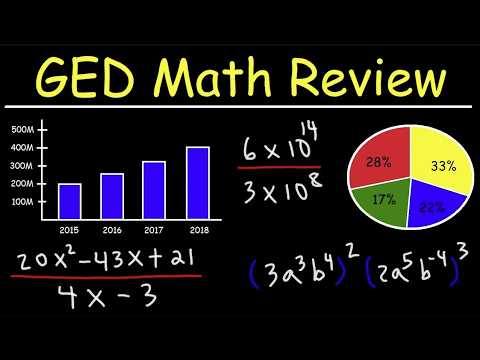
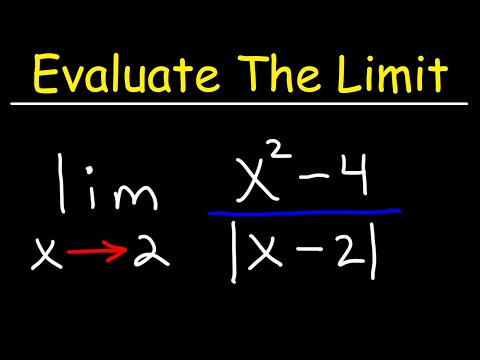
GED Math Playlist - Free Test Questions: https://bit.ly/3YOhN1a
Full GED Math Review - 482 Questions: https://bit.ly/4pfiJa3
Free GED Math Formula Sheet: https://www.video-tutor.net/ged-math-formula-sheet.html
@marigonarexhaj6605 Says:
8 am ....
@PotatoChips-t7z Says:
stats has always been difficult for me
@TheCuteCyanBird2008 Says:
Good answer. Nice job.
@excelacademy.000 Says:
plzz tell where to make these type of which app do you use to make these videos, to record audios
@player6845 Says:
I just was seeking this video on his channels and couldnt find it days ago
@STOICYOUTUBER-g8h1234 Says:
The best teacher in youtube when it comes to math
@Silentraven-y7u Says:
Thanks to you I did a question and my class was shocked cuz is for grade 12 and I'm in grade 7






LATEST COMMENTS