To try everything Brilliant has to offer�free�for a full 30 days, visit https://brilliant.org/ZachStar/ . The first 200 of you will get 20% off Brilliant's annual premium subscription.
STEMerch Store: https://stemerch.com/
?Follow me
Odysee: https://odysee.com/@ZachStar:0
Instagram: https://www.instagram.com/zachstar/
Twitter: https://twitter.com/ImZachStar
Support the Channel: https://www.patreon.com/zachstar
PayPal(one time donation): https://www.paypal.me/ZachStarYT
Join this channel to get access to perks:
https://www.youtube.com/channel/UCpCSAcbqs-sjEVfk_hMfY9w/join
2D Graphing Software: https://www.desmos.com/calculator
Animations: Arkam Khan (For contact info go to https://www.arqum333.com/)
Check out my Spanish channel here: https://www.youtube.com/channel/UCnkNu2xQBLASpj6cKC8vtpA
?My Setup:
Camera: https://amzn.to/2RivYu5
Mic: https://amzn.to/35bKiri
Tripod: https://amzn.to/2RgMTNL
?Check out my Amazon Store: https://www.amazon.com/shop/zachstar
Looks like a worse version of an E6B, and I didn't think the E6B could be any worse
@KurtBiedermann-h5i Says:
das Gruseligste daran ist. daß plus unendlich und minus unendlich am selben Punkt ist. wie in dem Gebet " von Ewigkeit zu Ewigkeit Amen"
@mariofrancisco6717 Says:
Muito bem explicado.
👏🏻👏🏻👏🏻👏🏻👏🏻
Como professor de engenharia elétrica, gostaria de poder indicar seu vídeo para os meus alunos.
@northerniltree Says:
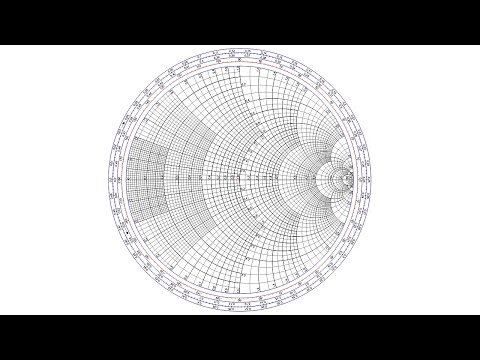
In life, when you have zero impedance, your message gets out clearly. The Smith chart agrees.
@eddill2638 Says:
3rd year EE student here.
Thanks a lot!
I've been struggling with my RF Engineering course and needed something better than my professor's notes. This video really helped explain the Smith Chart. Cheers!
@rafaelrodriguez6373 Says:
Los humanos escuchamos y vemos determinadas frecuencias de sonido y luz . Si un espíritu está a una mayor frecuencia no quiere decir que no exista simplemente porque no lo captamos. Elemental mi querido Watson
@ClippiClipstarr Says:
That looks easy not the crazy things we calculate and reform some functions I would literally be happy to see some charts I mean that’s something that you can literally learn 😅😂. I mean our doctor is not even audible 😅🤣
@makl8995 Says:
That smith chart has a lot of fibonacci on it.
@DERKONIG12345 Says:
I referred to website of rohde&schwarz it took 15 minutes to understand...
@coco9871 Says:
Easy
@octavio9657 Says:
Smith's diagram is nothing more than an abacus from when engineers calculated using abacuses and not computer programs.
In any case, it seems that this diagram stands the test of time.
Concise and informative. Very nice animation with worked numerical examples. Well done!
@ordep7878 Says:
Ningún aterrador es lo más práctico
@SubaramRamanathan Says:
Great. Excellent explanation.
Thank you so much.
@NelsonLFalconVeloz Says:
Genial vídeo gracias
@charadreemurr9337 Says:
That's really cool, thanks
Says:
Very interesting and useful. I feel smarter after watching this video.😊
@madbomber8183 Says:
If this is the scariest part im glad to have it over with
@mandy2tomtube Says:
What would be brilliant is if it were available to people without money as well
@gomezyafal Says:
Excellent explanation !
@luisa.machado6595 Says:
2:00 min.: Impedance is NOT resistance!
The confusion comes simply because Impedance is the ratio of voltage to current, just like resistance. But the likeness ends right there.
Resistance causes heating, energy dissipation, and loss of power in the conductor.
In a transmission line, however, there is no such loss due to Impedance because, being capacitive or inductive, the voltage and current alternate in 90 degrees apart. So, measured over a full wavelength, the effects add up to zero energy.
So, Impedance is just the OPTIMAL ratio of voltage to current for a wave to travel in a transmission line with zero or very small losses, which are due to resistance of the conductor. Such resistance should be very small.
@supremebohnenstange4102 Says:
I only ever knew the formulas never the chart
@vk2ig Says:
The Smith Chart is totally non-scary. It's a brilliant idea. In 3rd year electrical engineering at university we learnt not only how to use it, but also derive the equations which describe the R and X circles. 😊
@Torantes Says:
this is the best explanation ever! thank you!
@Takeitlightly6 Says:
No comedy today?
@IdrisNUMI Says:
Weed and masturbating is salt on the incisors with the index finger
@Mustylounge Says:
hey no spoilers man
@SNDN_LN Says:
The thumbnail looks like being inside a particle accelerator curving to the right.
@ukraineme96 Says:
After watching Zach Star’s comedy channel for years, this video has a weird dissociative effect on me
@thomassciurba5323 Says:
This is exactly why, even though I am an EE, I spent 40 years as an embedded software guy.
@tdg911 Says:
This is on the HAM extra test. Good stuff here and great explanation.
@manavburadkar2225 Says:
This is the Horror thing in engineering 😢
@benjamingordon1711 Says:
Quantum tunneling starter chart.
@SkreaminSkramp Says:
Look dude I don't care about the numbers and stuff. It's sacred geometry and I'm gonna pray to it. 👁️
@WHCafeRacer Says:
as a telecommunications engineer i have to say that this has more utilityes than obtaining the reflection coeficient
@Grognac619 Says:
My Grand Father invented this.
@SpaceEnthusiastRich Says:
This would be 100x easier to understand if they wouldnt try to cram a half dozen concepts into one damn chart. Also unis do an absolutely _criminal_ job of teaching how to use it.
@ROAMING9293 Says:
Learned this at Uni, eventually got fairly decent at it but now after being an engineer for 10yrs, I have no clue how to solve these hahaha 😅
@mohamedthecleaver Says:
I am a highschool student , and the fact that we didn't even finish 1/4 of the program yet I understood evrything you said make me wonder what in the actual f*** is waiting for me
Nobody has learned how to use it. We all know of it, but in real applications people just oversize things hoping it will be fine and ignore smith's chart.
@jimdigriz3436 Says:
Ahhh. These charts are quick and simple if you’re used to them. Doing the vector math is slow!
@PedroSalazarOrtega-tw1jt Says:
Thank you so much
@ramonatila6277 Says:
You’re lucky I’m smart and can understand cause you’re explaining like you’re explaining to your teacher or your classmates not like you’re trying to make a newbie understand


LATEST COMMENTS